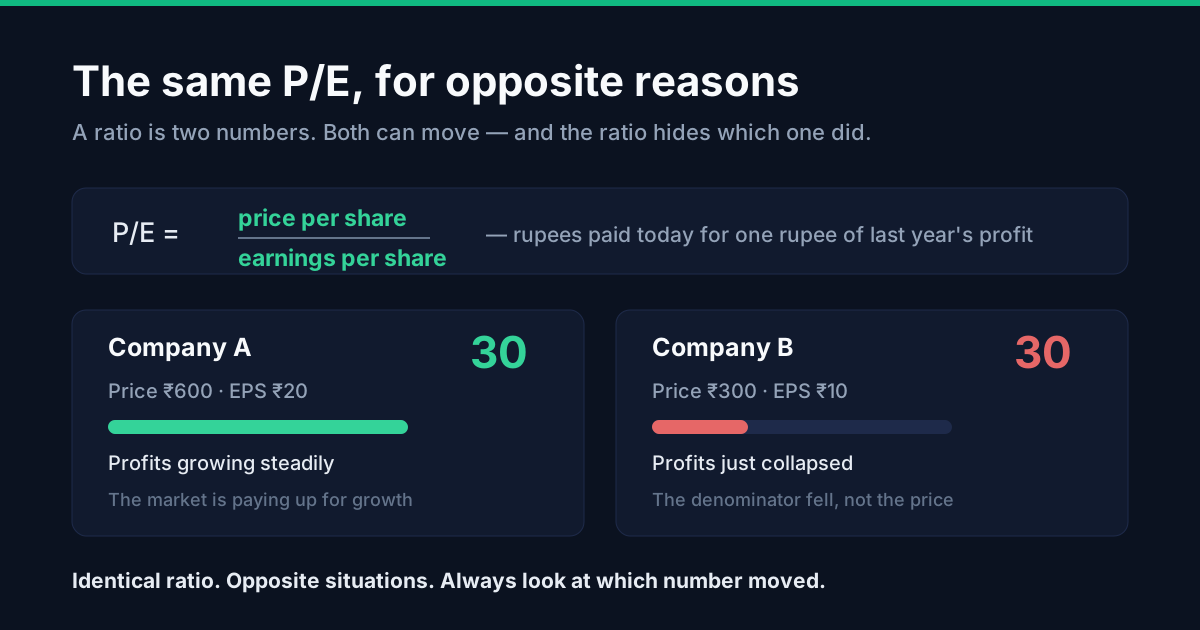
The price-to-earnings ratio tells you how many rupees you are paying today for one rupee of a company's annual profit. A stock at ₹600 earning ₹20 per share has a P/E of 30: thirty rupees of price for each rupee of earnings. That is the whole calculation, and it is genuinely useful — but it is two numbers in a trench coat, and the ratio alone never tells you which of them moved.
The calculation
P/E = price per share ÷ earnings per share
Earnings per share is net profit divided by the number of shares outstanding. Both inputs are public: the price updates every few seconds, the earnings update once a quarter.
Two versions are quoted, and they answer different questions:
- Trailing P/E uses the last four reported quarters. It is a fact — the earnings already happened.
- Forward P/E uses analysts' estimates for the next year. It is a forecast, and forecasts are wrong in predictable directions, usually optimistic.
When a screener shows a P/E without saying which, it is almost always trailing. When a brokerage note shows a flatteringly low one, it is often forward.
What a high or low number is actually saying
A P/E is not a measure of quality. It is a measure of expectation.
A high P/E means the market expects earnings to grow. Buyers are paying thirty or fifty times current profit because they believe profit will be much larger later. They may be right.
A low P/E means the market expects trouble, or simply isn't interested. That might be wrong — which is what a value investor is betting on — or it might be entirely correct.
This is why "low P/E = cheap" fails so often. The ratio has a denominator, and the denominator can fall.
The trap: the same ratio, opposite situations
Consider two companies, both at a P/E of 30.
Company A trades at ₹600 with earnings of ₹20 per share. Profits have grown steadily for five years. Its P/E is 30 because the price rose to reflect that growth.
Company B trades at ₹300 with earnings of ₹10 per share. A year ago it earned ₹30 per share and traded at ₹900. Earnings collapsed by two-thirds; the price fell by two-thirds. Its P/E is 30 because the denominator fell.
Identical ratio. Opposite situations. A screener sorting by P/E puts them side by side.
The pathological version is a company whose earnings fall almost to zero. Divide by a tiny number and the P/E becomes enormous — 400, 900 — which looks like wild overvaluation and is actually just arithmetic on a collapsed denominator. The reverse happens too: a one-off gain, like selling a factory, inflates earnings for a year and pushes the P/E down to something that looks like a bargain.
The habit that fixes this: never read a P/E without looking at the earnings trend behind it. Five years of EPS takes thirty seconds to scan and tells you which number moved.
When P/E does not work at all
The ratio is undefined or useless in several common situations:
| Situation | Why P/E fails |
|---|---|
| Loss-making company | Negative earnings make the ratio meaningless; screeners show "—" or a negative number |
| Cyclical businesses | Metals, cement, sugar: earnings peak and crash with the cycle, so a low P/E often marks the top |
| Banks and NBFCs | Earnings depend on provisioning judgements; price-to-book is usually more informative |
| Early-stage growth | Profits are deliberately suppressed to fund expansion |
| One-off gains or losses | Asset sales, write-offs and tax settlements distort EPS for a year |
The cyclical case is the one that catches people most. At the top of a commodity cycle, a steel company reports record profits, so its P/E looks low — and that is often the worst possible moment to buy, because the earnings are about to fall. For cyclicals, a high P/E can mean earnings are at a trough, which is closer to opportunity.
Comparing P/Es sensibly
A P/E in isolation means very little. It becomes informative in three comparisons:
- Against the company's own history. Is this expensive or cheap relative to what this business has usually commanded? A five-year range is a reasonable frame.
- Against close competitors. Compare an IT services company with other IT services companies, not with a bank. Different industries have structurally different ratios for good reasons.
- Against its growth rate. A P/E of 40 on a business growing 30% a year is a different proposition from a P/E of 40 on one growing 5%.
That third comparison is formalised as the PEG ratio — P/E divided by the earnings growth rate. A PEG near 1 is sometimes treated as "fairly priced". Treat that as a rough prompt rather than a rule: it depends entirely on the growth estimate, and growth estimates are the least reliable number in the whole exercise.
What the ratio genuinely cannot see
Even read carefully, P/E is silent about most of what determines whether a business is worth owning:
- Debt. Two companies with identical P/Es can have wildly different balance sheets. Earnings are stated after interest, but the ratio says nothing about how much debt is sitting there waiting to be refinanced.
- Cash generation. Profit and cash are different. A company can report earnings it has not collected.
- Earnings quality. Whether profit came from operations or from selling an asset.
- The future. The ratio is built on last year's earnings and today's price, and the future is the only part that actually matters.
This is the honest summary: P/E is a fast, free sanity check that tells you what the market currently expects. It is a starting question, not an answer. Anyone using it as a single buy signal is reading one line of a three-statement story.
FAQ
What is a good P/E ratio?
There is no universal figure. It depends on the industry, the growth rate and the interest-rate environment. A utility at 15 and a fast-growing consumer brand at 45 can both be reasonably priced, and both can be wrong. The useful question is not "is this number good" but "is this number justified by the growth and the risk".
Why do some companies show no P/E ratio at all?
Because they lost money. A negative denominator makes the ratio meaningless, so most screeners show a dash. For a loss-making company you need different tools — price-to-sales, cash burn, or a view on when profitability might arrive.
What is the difference between trailing and forward P/E?
Trailing uses the last four reported quarters of actual earnings. Forward uses analysts' estimates for the coming year. Trailing is a fact about the past; forward is a forecast, and a forward P/E always looks lower when analysts expect growth. Check which one you are being shown.
Can a low P/E be a bad sign?
Frequently. A low P/E can mean the market expects earnings to fall — and the market is often right. It is also characteristic of cyclical companies at the peak of their cycle, when record earnings make the ratio look cheap just before profits turn. A low P/E is a prompt to investigate, not a conclusion.
Why is P/E not useful for banks?
A bank's earnings depend heavily on how much it provides for loans that may go bad, and those provisions are a judgement. Two banks with similar reported profits can have very different loan books. Price-to-book, along with asset quality measures like gross and net NPAs, usually says more.
Does a high P/E mean a stock is overvalued?
Not by itself. It means the market expects significant earnings growth. If that growth arrives, the stock may turn out to have been cheap; if it does not, the price has a long way to fall. A high P/E raises the cost of being wrong — it does not tell you whether you are.